Diagnose performance bottlenecks using node-clinic | Review #1

Engineering @ Postman, loves to talk about concepts, system design, and the foundational aspects of software engineering.
Nodejs has proved to be highly performant, by cleaning dividing synchronous and asynchronous activities. However, at scale, there can be bottlenecks affecting performance severely, for example, even the slightest blocking in the event loop can increase the CPU drastically. It becomes hard to profile the user-land and dependencies to identity such bottlenecks.
In this blog, I will review a tool named node-clinic (by Clininc.js), that helps to profile and diagnose nodejs performance, and is super easy to get started with.
🧵 3 domains of diagnosis in Nodejs
- Resource vitals
The overall CPU, Memory, and network usage of the application. Application vitals anomalies can be due to synchronous & asynchronous operations, memory leaks, etc.
- Synchronous operations
Operations in Nodejs that block the event loop, and stays on the stack. Even native modules (including I/O) have their sync versions as well.
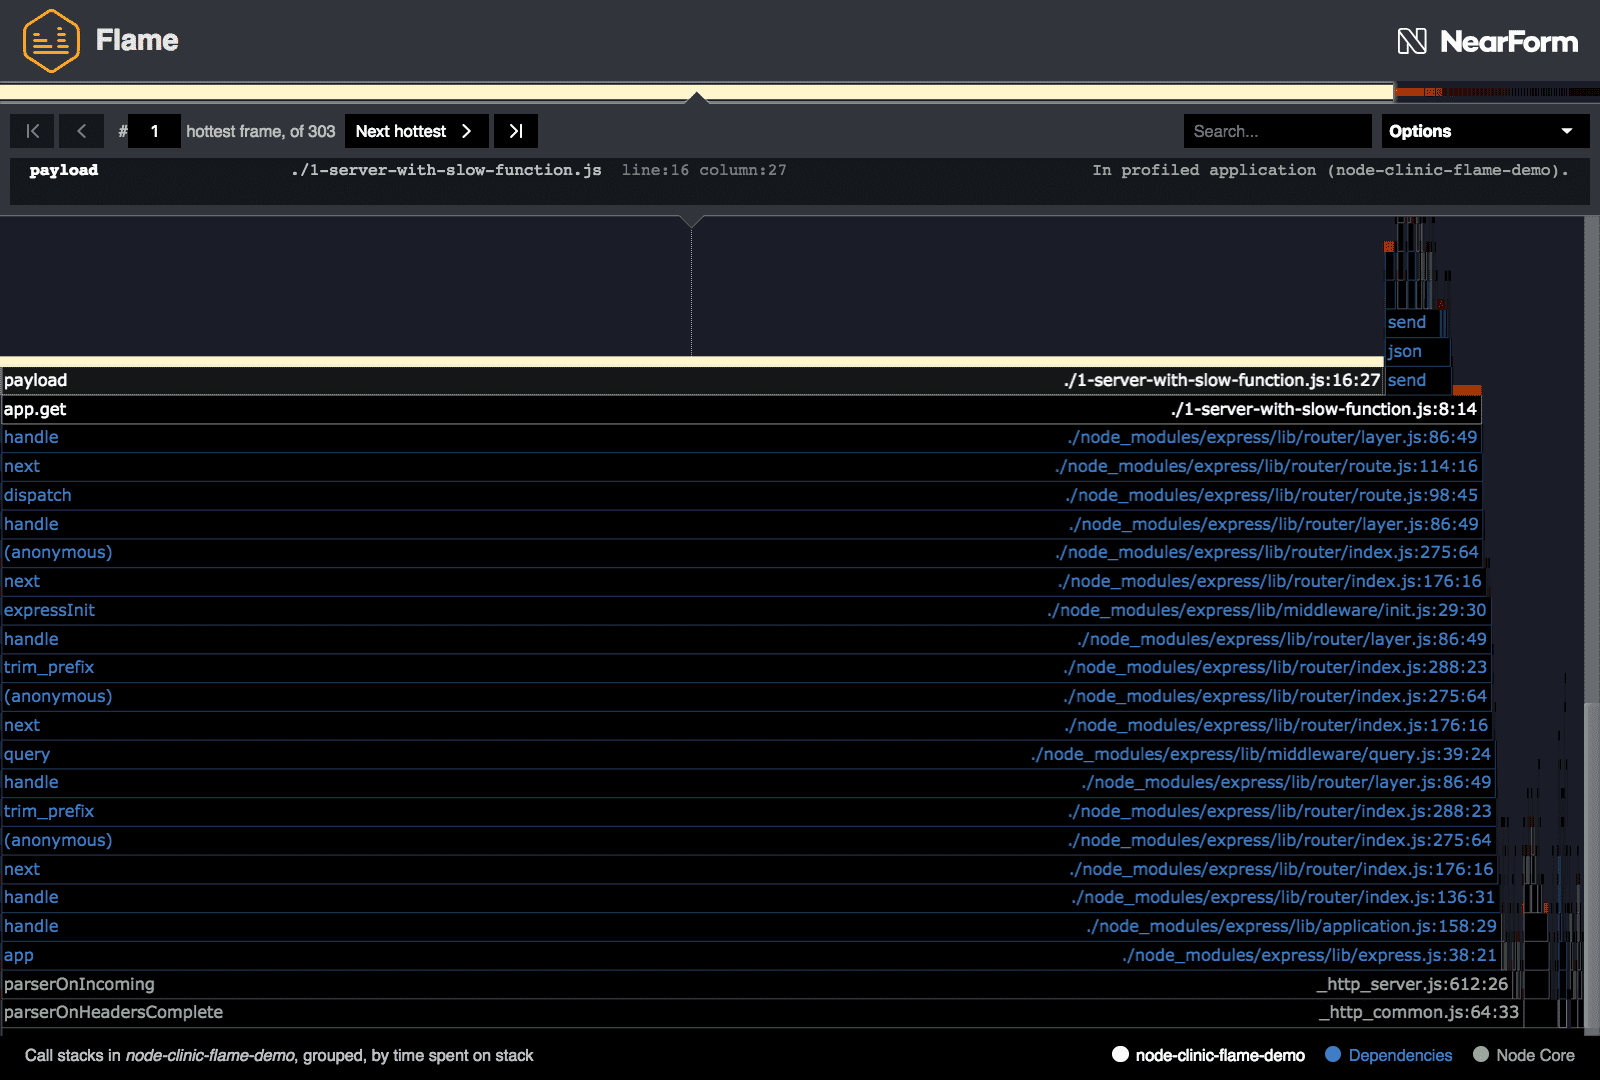
Flame graphs are used to find hot code paths (for synchronous operations) that consume the most CPU and stay on the stack for long. Flame graphs are a way of visualizing CPU time spent in functions.
- Asynchronous operations
I/O operations that are delegated to libuv to perform.
Profiling is done to find the throughput, concurrency, latency, etc of async operations. Check out the nodejs inbuilt profiler, if you are a fan of raw stuff.
⚡️ node-clinic by Clinic.js
There are multiple tools/packages available to diagnose each of the domains listed above, but none of them provides insights into all of the domains. Clinic.js has created a tool node-clinic that has 3 separate branches for each domain.
clinic doctor- for application vitalsclinic bubbleprof- for profilingclinic flame- for flame graphs
Any diagnostic tool works best when the application is load tested. node-clinic provides autocannon as their default load testing tool, but you are free to start your application with node-clinic, and load test in parallel with any tool you wish.
Getting started
npm install -g clinic
clinic --help
Clinic Flame
Run the application using the clinic
clinic flame -- node app.jsLoad testing using artillery
artillery quick --count 20 --num 100 https://foo.com/bar
🤟 Good things about node-clinic
- Easy to use and good DX.
- Good documentation around how to understand flame graphs, profiling, etc.
- Of course, a single tool for all types of diagnosis.
😶 Not so good (bad) things about node-clinic
- No easy way to integrate insights.
A great thing would have been to run this in CI pipelines, generate and publish insights as historical data points, and take actions if any metric is degraded.
Feel free to suggest more tools in the comments 📝
Thanks for reading! My Instagram DM is open for random conversations, including dev life too. Sometimes, I create videos too.


